In this analysis, I explore the historical trends in household formation and compare them with annual housing completions to assess their impact on the current housing shortage.
The change in households was gathered from data from three different surveys:
- The Annual Social and Economic Supplement (ASEC), HH-1 table
- The Housing Vacancy Survey (HVS), a supplement to the Current Population Survey done by the U.S. Census Bureau.
- American Community Survey
The supply of housing units was collected from FRED data for Total Households and New Privately-Owned Housing Units Completed (Total Units) and New Privately-Owned (Single Family Units).
First let’s look at data using the ASEC HH-1 data:
| Period | Change in Households (HH-1) | Housing Completions SF+MF | Surplus/ (Shortage) | |||
| 1970 – 2023 | 69,220,000 | 75,512,583 | 6,292,583 | |||
| 2000 – 2023 | 27,560,000 | 30,278,750 | 2,718,750 | |||
| 2008 – 2023 | 15,423,000 | 16,545,500 | 1,122,500 | |||
| 2010 – 2023 | 14,253,000 | 14,623,167 | 370,167 | |||
| 2013 – 2023 | 10,350,000 | 12,743,417 | 2,393,417 | |||
| 2018 – 2023 | 5,210,000 | 7,920,000 | 2,710,000 | |||
| Link: https://fred.stlouisfed.org | ||||||
| Population, Total for United States, Persons, Annual, Not Seasonally Adjusted | ||||||
| Total Households, Change, Thousands, Annual, Not Seasonally Adjusted | ||||||
| New Privately-Owned Housing Units Completed: Total Units, Thousands of Units, Annual, Seasonally Adjusted Annual Rate | ||||||
| New Privately-Owned Housing Units Completed: Single-Family Units, Thousands of Units, Annual, Seasonally Adjusted Annual Rate | ||||||
This data shows that housing units have been in surplus for every period considered since 1970, even the period after the GFC when housing construction fell dramatically.
Next, let’s review the data for household formation using the Housing Vacancy Survey:
| Period | Change in Households (HVS) | Housing Completions SF+MF | Surplus/ (Shortage) |
| 1970 – 2023 | 69,278,000 | 75,512,583 | 6,234,583 |
| 2000 – 2023 | 25,305,750 | 30,278,750 | 4,973,000 |
| 2008 – 2023 | 19,925,917 | 16,545,500 | (3,380,417) |
| 2010 – 2023 | 18,567,333 | 14,623,167 | (3,944,167) |
| 2013 – 2023 | 15,718,833 | 12,743,417 | (2,975,417) |
| 2018 – 2023 | 10,989,333 | 7,920,000 | (3,069,333) |
The data on households from the HVS survey is more in line with the consensus estimates of a housing shortage. Since the GFC, there has been a cumulative deficit of ~3.9 million housing units. Most of this shortage occurred over the last 5 years, when household formation was almost 11 million additional households, creating a shortage of ~3 million housing units since 2018.
American Community Survey data on the change in households was only available from 2010 through 2022:
| Period | Change in Households (ACS) | Housing Completions SF+MF | Surplus/ (Shortage) |
| 2010 – 2022 | 15,240,000 | 13,168,500 | (2,071,500) |
| 2013 – 2022 | 13,516,000 | 11,288,750 | (2,227,250) |
| 2018 – 2022 | 8,287,000 | 6,465,333 | (1,821,667) |
The ACS household data show a similar story, indicating a housing shortage of ~2 million housing units, most of which occurred during the last 5 years.
I need to spend some time to understand the difference between the surveys, specifically why the ASEC HH-1 data does not reflect the increase in household formation over the last decade. Clearly the increased rate of household formation, with a higher percentage of the population seeking an independent housing unit has been a large driver of housing demand and the resulting housing shortage.
The household formation rate, by which I mean the ratio of total households divided by total population, has increased steadily for at least the last 50 years.
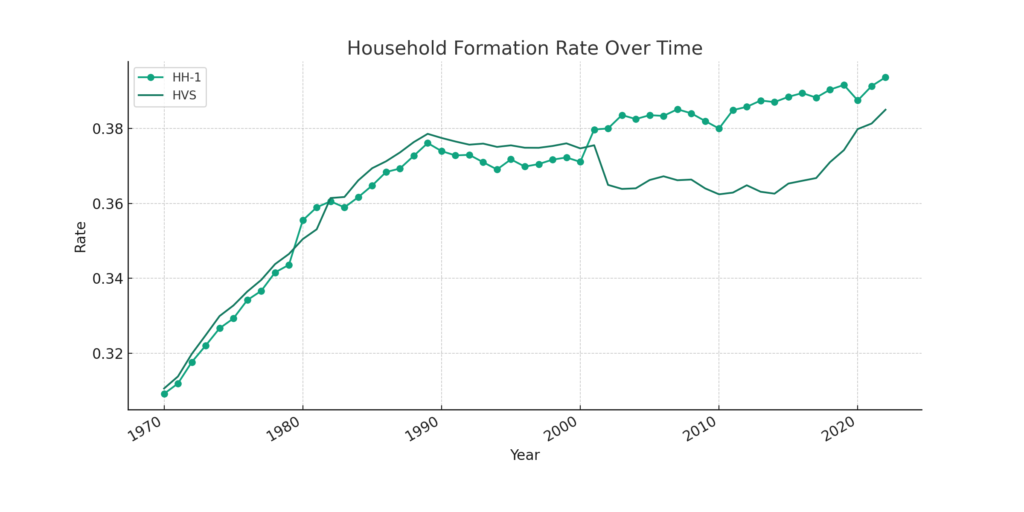
Since 2000, the household rate has increased by 1% – 2.2%, depending which Household survey you use. This might seem small, but relative to the population of ~333 million in the U.S., this equates to an additional 3.4 million to 7.5 million households. This behavior change, on top of an increasing population, has a lot to do with the housing shortage.